
Part 2: The Risks and Complications of T1D and Current Management Tools
This article was developed and published in September 2018. Some of the views and evidence presented in this article may have evolved since their original development due to advancing literature and knowledge. Please look out for more recent articles, publications, etc... for the most up to date information revolving these topics.
When I arrived at the hospital 12 years ago, after what I originally believed to be an extreme viral infection, I was assessed and diagnosed as a Type-1 Diabetic. At 16 years old, this diagnosis did not sink in right away and the only thing on my mind was getting back to my “normal” life. After a week in the hospital and a crash course in diabetes management, however, I realized I was now personally responsible for managing this disease for the rest of my life. I resigned myself to this new reality and assumed if I worked hard on managing this disease and following my doctor’s orders, I would be able to live just like everyone else. A decade later, during the early stages of my career as a research scientist, I realized the long-term outcome data does not support this and I was at risk for much more than initially anticipated. Type-1 Diabetes does not just mean one devastating diagnosis and it certainly does not guarantee positive outcomes when treated with current therapies alone…
In this section I will address:
Historical and Practical Diagnostic Biomarker for Assessing Diabetic Glycemic Control: Hemoglobin A1c
Data on Type-1 Diabetic Glycemic Control
Risks and Complications of Type-1 Diabetes
Current Treatment Strategies and Outcomes
Hemoglobin A1c: Emergence of a Diabetic Biomarker
Arguably, the most important and predictive biomarker for diabetic health is Hemoglobin A1c (HbA1c). Hemoglobin is the oxygen-carrying protein that sits inside a red blood cell. The primary role of hemoglobin is to transport oxygen from your lungs to the peripheral tissues, allowing for cells to produce energy (aerobic respiration). This vital molecule was initially discovered in 1840 by Hünefeld (Hünefeld, 1840). Over a century later, Max Perutz and John Kendrew were the recipients of a Nobel Prize when they discovered its molecular structure (M.F. Perutz, 1960; M. F. Perutz et al., 1960). In the 1960s, study of hemoglobin began to reach a peak when scientists became interested in analyzing the different types of hemoglobin, called hemoglobin variants [>1000(Thom, Dickson, Gell, & Weiss, 2013)]. While it was not known at that time, hemoglobin variant analysis would soon provide one of the most predictive and diagnostic biomarkers for Type-1 and Type-2 Diabetics.

Figure 1 Dr. Samuel Rahbar MD/PhD
Samuel Rahbar, an Iranian physician and scientist, began working on a variant of hemoglobin called Hemoglobin A under Hermann Lehmann, a Cambridge researcher. There, Rahbar worked to optimize hemoglobin variant analysis [variant types: Hemoglobin A1a-e, A2, F, H, etc..(S.L., 2011; Thom et al., 2013)]. At that time, it often took hours to analyze individual blood samples for hemoglobin variants. However, Rahbar optimized the hemoglobin analysis technique and began running up to 8 blood samples in less than 30 minutes. To expand on his research looking for new hemoglobin variants, Rahbar established his own research lab in Iran where he began running up to 300 blood samples a day. Rahbar would soon make one of his greatest discoveries when running the blood sample of a 67-year-old woman. He discovered something odd in this patient variant analysis. Typically, when running the analysis, he would have expected to see just two variants, hemoglobin A and hemoglobin A2. Instead, he saw what appeared to be a third unknown variant around the region were Hemoglobin A was observed

Figure 2 Hemoglobin Bands. 1) Diabetic, 2) Normal Healthy Subject, and 3) Purified HbA1c (Rahbar, Blumenfeld, & Ranney, 1969)
Looking for clues as to the origin of this variant, Rahbar scanned the patient’s medical record and discovered her chart clearly stated “diabetic.” To determine if this variant was that of a new, undiscovered genetic variant and/or something related to the patient’s diabetes diagnosis, Rahbar analyzed the blood from an additional 47 diabetic patients. To his surprise, all 47 Iranian diabetics had this faint third variant (Rahbar, 1968). To confirm this finding, Rahbar traveled to the United States to work with Helen Ranney at the Albert Einstein College of Medicine, where he further improved his hemoglobin analysis technique. Rahbar analyzed the blood of 140 US diabetic patients. Again, he consistently found this same exact variant. Through this work, he eventually discovered and isolated what is now known as HbA1c, also known as glycosylated hemoglobin [Figure 2(Rahbar et al., 1969)]. Today, HbA1c is used to determine the average blood glucose levels over a 2-3month period in diabetics and non-diabetics alike. HbA1c is also used as a diagnostic tool for determining diabetic status and predicting diabetic outcomes [Figure 3(American Diabetes, 2010; International Expert, 2009)].

Figure 3 Hemoglobin A1c % Diagnosis Categories for Patients. Normal = <5.7% HbA1c; Pre-diabetes = 5.7-6.4% HbA1c; Diabetes = >6.4% HbA1c.
In 2012, Rahbar was awarded by the American Diabetes Association for his discovery linking HbA1c levels to diabetic status. A short summary of the history of HbA1c’s discovery can be seen in Table 1 (Gebel, 2012).

Hemoglobin A1c: Practical Example
Fiigure 4 is an example of how HbA1c works in a practical setting: The left and right figures represent controlled and uncontrolled weekly blood glucose trends and how they ultimately affect the percentage of HbA1c found in the blood, respectively. Glucose is an interactive molecule and can spontaneously and/or enzymatically bind to other molecules, a slow chemical process called glycosylation. Consequently, when blood glucose is higher over a 2-3 month period, more glucose will bind to the hemoglobin A variant, elevating the levels of the glycosylated form of hemoglobin A, HbA1c. This is why Rahbar was able to originally detect this faint hemoglobin variant in diabetics, but not healthy individuals. Additionally, in much larger recent controlled trials with Type-1 Diabetic patients, average blood glucose levels correlate strongly with HbA1c levels, confirming these previous findings [Figure 5(Rohlfing et al., 2002)]. Consequently, HbA1c has emerged as the most critical markers for chronic glycemic control and one of the most, if not the most, critical biomarkers for a diabetic’s health.

Figure 4 Daily Blood Glucose’s Influence on HbA1c Levels. With higher average blood glucose values, HbA1c increases

Figure 5 Mean Plasma Glucose (MPG) vs Mean HbA1c Correlation. Data taken from over 1,400 Type-1 Diabetics during Diabetic Control and Complications Trial (DCCT) indicating a strong correlation between average blood glucose levels and HbA1c. Figure 1 from (Rohlfing et al., 2002)
Are Type-1 Diabetics Able to Achieve Glycemic Control?

In 2014, Pinhas-Hamiel and colleagues assessed the average HbA1c in 349 Type-1 Diabetic patients to determine the average HbA1c across age groups [Figure 6 (Pinhas-Hamiel et al., 2014)]. The yellow line illustrates the median HbA1c (middle 50%) of participants at each age range. The blue line represents the lowest 10% while the red line represents the top 10%

Figure 6 Illustration of the HbA1c for the Typical Type-1 Diabetic (n=349) Across Different Age Ranges. Figure 1 from (Pinhas-Hamiel et al., 2014).
To illustrate how these HbA1c values translate to average blood glucose numbers, I modified the above graph using the diabetes.org conversion formula (https://professional.diabetes.org/diapro/glucose_calc) to illustrate how estimated 2-3month average blood glucose values tracked across age groups (Figure 7).

Figure 7 The 2-3 month Average Blood Glucose Observed for the Typical Type-1 Diabetic (n=349) Across Different Age Ranges. Modified Figure 2 from (Pinhas-Hamiel et al., 2014).
This data illustrates that the average Type-1 Diabetic from 2-30 years of age is sitting around 154-183mg/dL (Pinhas-Hamiel et al., 2014). Since normal blood glucose range is 80-120mg/dL, these Type-1 Diabetic’s blood glucose averages represent 2x the normal healthy level. This is concerning, since adverse health consequences can be attributed directly to elevated blood glucose levels (see detailed discussion later).

Figure 8 The average HbA1c observed in Type-1 Diabetic from T1D Exchange Data (Exchange)
This image above is taken from T1D Exchange Data (Exchange). T1D Exchange is a website that collects patient data (https://t1dexchange.org/pages/) from 20,000+ Type-1 Diabetics to “inform product development, drive better clinical care, and contribute to scientific discoveries.” In their data cohort, Hightower found that the average HBA1c is 8.43%. This correlates to an estimated 2-3-month blood glucose average of 195mg/dL. Looking at this data recently (Exchange), the average HBA1c in more than 25,000 Type-1 Diabetes is ~8.0%, associated with a 2-3 month blood glucose average of 183mg/dL. Both numbers again confirm that Type-1 Diabetics typically have 2x the normal blood glucose floating around in their blood versus a non-diabetic.

In 2014, a large group of researchers looked at the glycemic control (HbA1c) of 324,501 Type-1 Diabetics across 19 different countries (McKnight et al., 2015). This is the largest analysis of glycemic control conducted to date. They categorized Type-1 Diabetics across age, gender, and HbA1c levels (Table 2).
The authors calculated the percentage of Type-1 Diabetics who achieved a HbA1c below 7.5%, between 7.5-8.9%, and at or above 9.0%. The author’s chose these HbA1c categories since the DCCT and EDIC trial data reported that a HbA1c <7.5%, versus >9.0%, changed the incidence of complications and risks in Type-1 Diabetics (Nathan et al., 2005; White et al., 2008). Thus, the authors wanted to know how many Type-1 Diabetics are in this reduced risk category. These authors found that 72% of Type-1 Diabetics had an HbA1c 7.5% or above. This translates to 72% of Type-1 Diabetics having an average blood glucose level at or above 169mg/dL… Unfortunately, 31% of all Type-1 Diabetics in this analysis had an average blood glucose level of ~212mg/dL or HIGHER.

Table 2 Type-1 Diabetic HbA1c Global Population Analysis. Modified Table 2 from (McKnight et al., 2015)
These three examples above are not alone.... additional studies confirm these findings:
http://care.diabetesjournals.org/content/39/12/e214
HBA1c: 8.2-8.7% → 189-203mg/dL [n=1,972; (Sherr et al., 2016)
https://jamanetwork.com/journals/jamaophthalmology/article-abstract/635006?redirect=true
HBA1c: 12.6% → 298mg/dL [n=996; (Klein, Klein, Moss, Davis, & DeMets, 1984)]
https://www.ncbi.nlm.nih.gov/pmc/articles/PMC3867999/
HBA1c: 7.2-9.1% → 160-214mg/dL [n=1,441; (Nathan & Group, 2014)]
https://www.ncbi.nlm.nih.gov/pubmed/9850487
HBA1c: 7.05-7.09% → 156-157mg/dL [n=3,867; (Turner, 1998)]
http://care.diabetesjournals.org/content/34/8/1843
HBA1c: 7.3% → 163mg/dL [n=268; (Kuenen et al., 2011)]
https://jamanetwork.com/journals/jama/fullarticle/2656808
HbA1c: 8.0-8.2% → 183-189mg/dL [n=30,579; (Karges et al., 2017)]
https://www.thelancet.com/journals/lancet/article/PIIS0140-6736(18)31506-X/fulltext
HbA1c: 7.9-8.5% à 180-198mg/dL [n=27,195; (Rawshani, 2018)]

Figure 9 Hemoglobin A1c % Diagnostic Categories. Normal = <5.7% HbA1c; Pre-diabetes = 5.7-6.4% HbA1c; Diabetes = >6.4% HbA1c; Type-1 Diabetics = 7.0-9.0% HbA1c
Combined, these studies illustrate (in more than 400,000 Type-1 Diabetics) HbA1c across a wide range (~7-12.6%), with an overall estimated average HbA1c around 8%. Thus, we can predict that the average blood glucose in most Type-1 Diabetics is ~183mg/dL, 2x the healthy range. What does this mean for a Type-1 Diabetic? What are the consequences to chronically elevated blood glucose levels? What does this tell us about blood glucose stability/instability?
Stable or Unstable Blood Glucose?
The above HbA1C data illustrates high average blood glucose values in Type-1 Diabetics. Additional analysis has found that higher HbA1c’s are associated with more daily blood glucose variability/instability (Kuenen et al., 2011). Additionally, higher HbA1c’s have been linked with higher the risk for hypoglycemia ("Hypoglycemia in the Diabetes Control and Complications Trial. The Diabetes Control and Complications Trial Research Group," 1997). Taken together, higher HbA1c’s typically accompany more major blood glucose instability and hypoglycemic moments. This can be extremely dangerous for a Type-1 Diabetic.

Table 3 Blood Glucose Variability in Type-1 and Type-1 Diabetics. Data illustrates the differences between Type-1 and Type-2 Diabetic’s mean plasma glucose and glucose variability (standard deviation) in top two red boxes. Amount of standard deviation is broken down into 4 categories across this Type-1 Diabetic population (bottom red boxes). Modified Table 1 from (Kuenen et al., 2011).
Kuenen et al. 2011 looked at Type-1 Diabetic blood glucose variability/instability using a measurement called standard deviation [Table 3; (Kuenen et al., 2011)]. Put simply, they looked at how far above and below the average blood glucose levels a Type-1 Diabetic fluctuates on a day-to-day basis. The average blood glucose in these Type-1 Diabetics was 162mg/dL and the average deviation was 64.8mg/dL. Translation? These Type-1 Diabetics fluctuated 60mg/dL above and 60mg/dL below 162mg/dL, DAILY… This equates to 120mg/dL fluctuations up and down... This study also found that greater than 90% of Type-1 Diabetics observed had fluctuations larger than 30mg/dL from their mean blood glucose, with more than 57.8% of Type-1’s fluctuating between 60-90mg/dL above and below their mean blood glucose…. This should not come as a surprise if you look at the average blood glucose tracings for many Type-1 Diabetics (Section 1-Figure 9-10)…
Acute Symptoms of Blood Glucose Fluctuations

Figure 10 Type-1 Diabetic 24-Hour Blood Glucose Tracing. Taken from Section 1-Figure 9 illustrating daily blood glucose trends and subsequent symptoms of hyperglycemia and hypoglycemia.
Frequent fluctuations in blood glucose often signals an accumulation of both high (hyperglycemic) and low (hypoglycemic) blood glucose symptoms (Figure 10). Often, Type-1 Diabetics are experiencing these symptoms daily, sometimes multiple times a day. Does that mean each day is ruined? Not necessarily. None the less, accumulation of hypoglycemic and hyperglycemic symptoms may significantly influence the quality of life in patients where this occurs frequently (Rombopoulos, Hatzikou, Latsou, & Yfantopoulos, 2013; Vanstone, Rewegan, Brundisini, Dejean, & Giacomini, 2015; Yfantopoulos, Hatzikou, Rombopoulos, Panitti, & Latsou, 2014). Since most Type-1 Diabetics’ average blood glucose is well above the normal range with large variability in blood glucose levels, chronic symptoms are a reality for the vast majority of Type-1 Diabetics.
Symptoms of hyperglycemia include (Staff, 2018a): https://www.mayoclinic.org/diseases-conditions/hyperglycemia/symptoms-causes/syc-20373631
Symptoms of hypoglycemia include (Staff, 2018b): https://www.mayoclinic.org/diseases-conditions/hypoglycemia/symptoms-causes/syc-20373685
However, this is just the day-to-day burden of Type-1 Diabetes. Over time, Type-1 Diabetics are set up for increased risk for many other devastating diagnoses.

Does Type-1 Diabetes Just Mean One Diagnosis?
Livingstone et al. 2015 compared 24,691 Scottish Type-1 Diabetics to non-diabetics (Livingstone et al., 2015). They looked at the rates of mortality across different diseases (and non-disease causes of death) and predicted life expectancy. Table 5 reported the rates of death across age and sex. Red boxes were used to indicate where Type-1 Diabetics experience increased rates of death for a cause of death (cancer, cardiovascular disease, suicide, etc.). Type-1 Diabetics had higher rates of death across all causes of death when compared to non-diabetics. This data clearly suggests that Type-1 Diabetics are set up for more than just one devastating diagnosis. It means increased risk for many other diseases. This study went on to predict the expected survival of both male and female Type-1 Diabetics compared to their non-diabetic counterparts. The results are shocking (Figure 11): Type-1 Diabetics are predicted to live over a decade shorter, on average, than their non-diabetic peers.

Table 5 Cause-Specific Mortality Rates for Type-1 Diabetics and Non-Diabetics. Modified eTable1 from Supplemental Data indicating the cause of death in Type-1 male and females across age categories (Livingstone et al., 2015). Red boxes indicate where a Type-1 is at increased risk.

Figure 11 Reduced Life Expectancy of Type-1 Diabetics compared to Age Matched Non-Diabetics. Modified Figure 1 from (Livingstone et al., 2015).

In 2018, Rawshani et al. wanted to expand on these findings and determine if age of diagnosis also impacted the risk of death and/or disease (Rawshani, 2018). Rawshani et al. followed 27,195 swedish type-1 diabetics for a median length of 10 years. Compared to 135,178 matched controls, type-1 diabetics diagnosed before 10 years of age had 30 times the risk of developing coronary heart disease and a heart attack (Figure 12). Horrifyingly, type-1 Diabetic women diagnosed before 10 years of age had 60 and 90 times the risk of developing coronary heart disease and a heart attack, respectively. The risk of dying from any disease was 4.11 and 3.62 times higher in type-1 diabetic diagnosed at 0-10 and 26-30 years of age, respectively, compared to controls. Ultimately, diagnosis of type-1 diabetes before the age of 10 years was predicted to result in a loss of 17.7 and 14.2 years for women and men, respectively. If you were not diagnosed till 26-30 years of age, you are still predicted to lose 10 years off your life. These results not only confirm Livingstone et al. 2015 but portray a more devastating picture (Livingstone et al., 2015).

Figure 12 Adjusted Hazard Ratios for Cause of Death and Disease Diagnosis in Type-1 Diabetics Compared to Matched Non-Diabetics. Hazard ratio is the rate of incidence in Type-1 Diabetics divided by the rate of incidence in matched non-Type-1 Diabetics. Males and females were combined for this analysis. Modified Figure 2 from (Rawshani, 2018).

In 2018, Conway et al. compared the risk of disease and mortality in Type-1 Diabetics who were diagnosed with T1D under 20 years of age (early onset) or diagnosed at 20-29 years old (late onset) (Conway et al., 2018). The authors went on to compare these Type-1 Diabetics to non-diabetics (Table 6). The authors wanted to find out if the age of diagnosis for Type-1 Diabetes influenced the risk for various other diseases. Conway found that Type-1 Diabetics had increased risk for all-cause mortality along with increased risk for a host of other common diseases including heart disease, kidney disease, respiratory disorders, infection, cancer, and accidents. Although this study only looked at individuals who were diagnosed once they reached 40 years of age (excludes those individuals who did not survive to 40 years of age), these results portray a similar picture to Livingstone et al. 2015 findings that Type-1 Diabetics are at increased risk for many of the leading causes of death compared to their non-diabetic peers (Livingstone et al., 2015).

Table 6 Incidence of Death in Childhood and Young-Adulthood Onset Type-1 Diabetes Compared to Non-Diabetics. Analysis also compared white versus African American Type-1 Diabetic to controls. Red boxes indicate where incidence was higher in a Type-1 Diabetic compared to matched non-diabetic. Modified Table 2 from (Conway, Lopes-Virella, & Blot, 2018).
Livingston et al. 2015, Conway et al. 2018, and Rawshani et al. 2018 provide just three examples in the literature illustrating the chronic disease risk burden and reduced survival in Type-1 Diabetics (Conway et al., 2018; Livingstone et al., 2015; Rawshani, 2018). This data, illustrates that Type-1 Diabetics are at increased risk for ALL 10 of the current leading causes of death (Murphy SL, 2017)
Evidence supporting this claim across each of the leading causes of death (and more) detailed below
Type 1 Diabetics are at an increased risk for:
Overall mortality:
(Conway et al., 2018; Diabetes, Complications Trial /Epidemiology of Diabetes, & Complications Study Research, 2016; Lind et al., 2014; Livingstone et al., 2015; Rawshani, 2018)
https://www.thelancet.com/journals/lancet/article/PIIS0140-6736(18)31506-X/fulltext
http://care.diabetesjournals.org/content/early/2016/05/14/dc15-2399
This study indicated increased risk for T1D compared to general population for overall mortality ONLY when HbA1c was greater than 8.5%.
https://www.nejm.org/doi/full/10.1056/NEJMoa1408214
33,915 patients with Type-1 Diabetes from Scottish community (same data based as 2015 JAMA paper) found that overall mortality over an 8-year period as 8% in T1D versus 2.9% in matched non-diabetic controls. HbA1C predicted death and cardiovascular adverse health events. Higher HbA1C increased cardiovascular and mortality events in a concentration dependent manner.
1. Heart Disease (Conway et al., 2018; Livingstone et al., 2015; Livingstone et al., 2012; Rawshani, 2018; Soedamah-Muthu et al., 2006)
2. Cancer (Carstensen et al., 2016; Livingstone et al., 2015)
3. COPD (Conway et al., 2018; Livingstone et al., 2015)
4. Accidents (Conway et al., 2018; Kennedy et al., 2002; Songer & Dorsey, 2006)
Combined Type-1 and Insulin Treated Type-2
5. Stroke (Conway et al., 2018; Livingstone et al., 2015; Rawshani, 2018; Stahl et al., 2017)
6. Alzheimer’s (Whitmer RA, 2015)
7. Diabetes
8. Infection (Conway et al., 2018; Livingstone et al., 2015; Simonsen et al., 2015)
9. Kidney Disease (Conway et al., 2018; Livingstone et al., 2015)
10. Suicide (Livingstone et al., 2015; Sarkar & Balhara, 2014)
● Cognitive Decline:
(Chaytor, 2016; Chaytor et al., 2018; He, Ryder, Li, Liu, & Zhu, 2018; Nunley et al., 2015)
http://care.diabetesjournals.org/content/early/2015/07/01/dc15-0041
https://www.sciencedirect.com/science/article/pii/S1056872718301090#!
Altered brain anatomy (Fox et al., 2018; Mazaika et al., 2016)
● Retinopathy:
[Vision Damage effects greater than 80% of Type-1 Diabetics; (Fong et al., 2004; Hietala et al., 2010; Klein et al., 1984; Klein, Knudtson, Lee, Gangnon, & Klein, 2008)]
● Growth Impairment:
(Physical; (Bonfig et al., 2012; Frohlich-Reiterer et al., 2011; Hannon & Rogol, 2012; Khadilkar et al., 2013; Parthasarathy, Khadilkar, Chiplonkar, & Khadilkar, 2016)
https://www.ncbi.nlm.nih.gov/pubmed/22361220
This data provides stark evidence that Type-1 Diabetics are NOT just set up for one diagnosis, they are set up for increased risk for all ten of the leading causes of death and a predicted reduction in survival by approximately a decade.
It is important to mention what “risk” means. Risk means that you have an elevated chance. It does not mean YOU WILL get it. I personally know Type-1 Diabetics who are older than 80 years old and have lived with Type-1 Diabetes for more than 60years and have zero complications. I also know other Type-1 Diabetics who have lived less than 60 years with Type-1 Diabetes and have many related complications. These values are just risks, not guarantees. None the less, it is critical to understand where you may be at increased risk, so you can be proactive in mitigating those circumstances.
Why are Type-1 Diabetics at risk for acute stress events as well as devastating chronic diagnoses?
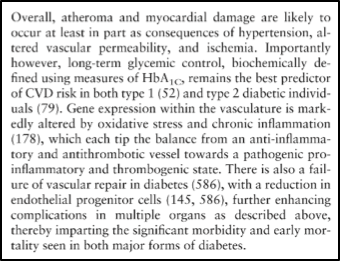
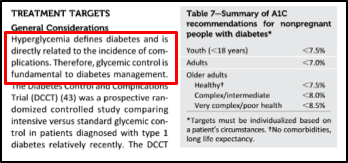
The answer to this seems quite clear and logical. Most of the risks and complications of Type-1 Diabetes can be tied directly or indirectly to the lack of glycemic control [chronically elevated blood glucose and large blood glucose fluctuations (poor glycemic control)] that are often a normal accepted part of a Type-1 Diabetic’s life. This is conveyed in some prominent papers in the field of Type-1 Diabetes (Atkinson, Eisenbarth, & Michels, 2014; Bluestone, Herold, & Eisenbarth, 2010; Chiang, Kirkman, Laffel, Peters, & Type 1 Diabetes Sourcebook, 2014; Daneman, 2005; Forbes & Cooper, 2013; Maahs, West, Lawrence, & Mayer-Davis, 2010).
See excerpts from these publications below:


With the emergence and discovery of HbA1c and its association with long-term diabetic glycemic control, accurately predicting Type-1 Diabetic complications and risks has become much more viable. Unfortunately, with this discovery, it has also become clear that Type-1 Diabetics do not typically achieve HbA1c values which resolve them of the risks and complications that accompany chronically elevated and frequently variable blood glucose levels. While HbA1c is the most important predictor of Type-1 Diabetic complications, other factors of glycemic control also contribute to risk for complications such as fasting glucose levels, post-prandial hyperglycemia, total glucose exposure, and HbA1c variability over time (Ceriello, 2005; Kilpatrick, Rigby, & Atkin, 2008a, 2008b; Lachin et al., 2008). Consequently, normalizing blood glucose and achieving glycemic control would likely reduce many of the risks and complications that are tied to glycemic mismanagement. It also seems logical that proactively mitigating risk would prove more fruitful than attempting to manage complications after they have already arisen (prevention versus management). This is encouraging as it presents a solution and a goal.
In theory, normalizing glycemic control would then normalize the aforementioned risks and complications. With the emergence of new Type-1 Diabetes management techniques and technologies, has this improved the glycemic control in Type-1 Diabetics? What are these new technologies and how effective are they?
Type-1 Diabetes Current Glycemic Management Techniques and Technological Solutions
In the section below, 8 different diabetic treatment strategies or technologies are discussed. These strategies and technologies were developed to help Type-1 Diabetics improve glycemic control or reduce the burden of managing this disease. Utility and effectiveness of each treatment strategy and/or technology is discussed and example studies are provided.
Carbohydrate Counting
Intensive Treated Therapy
Insulin Pumps
Continuous Glucose Monitor
Closed Loop System
Islet-Cell Transplantation
BCG Vaccine
Stem Cells
1. Carbohydrate Counting

Figure 13 Eli Lilly’s Carbohydrate Counting Guides for Diabetes and Diabetic Caregivers.(Constance A, 2011; Spiegel G, 2015)
Carbohydrates have the greatest impact on blood glucose levels (see Section 3). Consequently, higher blood glucose means higher insulin requirements. Thus, understanding the insulin requirements for the quantity of carbohydrates ingested is critical. The Carbohydrate Counting strategy is a therapeutic approach that guides Type-1 Diabetics to estimate carbohydrate load (i.e. 15g carbohydrates = 1 carbohydrate count) and insulin requirements (i.e. 15g carbs:1IU insulin). This therapeutic approach is frequently taught upon diagnosis to almost all Type-1 Diabetics.
Does it improve glycemic control in patients?

Table 7 HbA1c at Baseline, 1-Year Post, and 2-Years Post Carbohydrate Counting Strategies Versus Control. Table 3 from (Goksen, Atik Altinok, Ozen, Demir, & Darcan, 2014)
Goksen et al. evaluated whether the Carbohydrate Counting therapeutic approach improved glycemic control and cardiovascular health in Type-1 Diabetics (Goksen et al., 2014). These patients were taught carbohydrate counting and how to determine insulin requirements per meal. These patients utilized this approach while ingesting 50-55% of total caloric load in carbohydrates.
This study found that the carb counting group had higher HDL than the control group after 2 years of using the carbohydrate counting strategy. There were no changes in insulin dosages, BMI, triglycerides, cholesterol, and LDL between groups. However, the study did show a significant decrease in HbA1c after two years of using the carbohydrate counting strategy.
How much did HbA1c decrease?
HbA1c decreased by 0.23% (Table 7), meaning that this carbohydrate counting group decreased average blood glucose from 186mg/dL to 179mg/dL. While this decrease by ~7mg/dL was statistically different, it does not represent a tangible difference in glycemic control.
2. Intensive Treated Therapy
Intensive Treated Therapy is an insulin treatment strategy that encourages more frequent assessment of blood glucose levels and insulin corrections. It derives its name “intensive” as it was once believed that taking more than 2 insulin injections/day was “intense.” It was thought that more than 2 insulin injections/day may contribute to hypoglycemia and that less than 3 insulin injections/day would result in “freedom from symptoms of hyperglycemia and frequent or severe hypoglycemia.” Now, ≥3 injections/day is quite normal.

To assess whether more frequent monitoring of blood glucose and 3 or more insulin injections/day, would produce better outcomes, two of the largest and longest Type-1 Diabetic controlled trials was developed (Diabetes et al., 1993; Diabetes et al., 2009). These trials were termed “The Diabetes Control and Complication Trial/Epidemiology of Diabetes Intervention and Complications (DCCT/EDIC) Research Group” and spanned across numerous universities and clinics. In these trials, an intensively treated therapy group (Type-1 Diabetics with ≥3 insulin injection/day OR continuous insulin infusion using an insulin pump) was compared to a conventional therapy group (≤2 insulin injections/day).
Does it improve glycemic control in patients?

Table 8 HbA1c Levels Pre- and Post-Intensive Treatment Therapy Versus Control from Both DCCT and EDIC trials. Table 1 from (Diabetes et al., 2009)
While the reduction in HbA1c was impressive, the focus of this trial was the marked reduction in diabetic complications in the intensively treated group (Table 9). This trial is often cited as evidence that intensively treating and lowering HbA1c does lead to reduced complications in Type-1 Diabetics (NIDDK, 2008). This trial also provided the strongest correlation data between average blood glucose levels and HbA1c, which played a substantial role in HbA1c becoming the diagnostic biomarker it is today (Rohlfing et al., 2002).
While this trial did show a reduction in complications with reduced HbA1c, average blood glucose remained elevated well above the healthy blood glucose range (166mg/dL). Consequently, the intensive treatment therapy group STILL had complications.
The conventional group went up from 8.9% HbA1c to 9.1% while the intensive group went from 8.9 to 7.4%. The intensive group saw a 1.5% decrease in HbA1c, equating to a drop in average blood glucose from 209mg/dL to 166mg/dL (43mg/dL). Due to these impressive outcomes, the conventional group was switched over to intensive treatment and dropped their average HbA1c from 9.1% to 7.7% (40mg/dL).

Table 9 Incidence of Complications Between Conventional and Intensive Treatment Therapy from DCCT and EDIC Trials. Table 3 from (Diabetes et al., 2009)
3. Insulin pumps


Figure 14 Medtronic Insulin Pump
The insulin pump was developed to remove the burden of multiple insulin injections/day and has multiple components (Figure 14). Injections can be precisely measured (down to 0.1IU) and infused. Insulin pumps can provide both basal and bolus insulin doses (Section 3). Additional benefits of insulin pumps include: 1) removing the burden of carrying insulin vials and syringes and 2) allowing the user to shut off insulin infusion [not an option when using long-acting insulin injections (Section 3)]. However, insulin pumps also have potential draw backs: 1) continuous insulin infusion into the same spot can cause irritability and infection at the infusion site, and this consequently leads to insulin resistance; 2) insulin pump must be worn all the time.
Does it improve glycemic control in patients?

This study is one of the largest to evaluate the HbA1c in more than 30,000 Type-1 Diabetics using insulin injections vs insulin pumps (Karges et al., 2017). This study found that the average HbA1c for injection versus pump therapy was 8.2% and 7.9%, respectively (2x normal blood glucose). This observation study provides evidence for inconsequential differences in average blood glucose levels achieved in injection therapy and pump therapy users.

Table 8 HbA1c in Injection Therapy Versus Pump Therapy in Matched and Unmatched Cohorts (n=19,628 vs 30,579). Table 1 from (Karges et al., 2017)
While these results do not show tangible benefits, the results across different studies for pump therapy are somewhat variable (some show improvement, some do not). That said, no insulin pump trial normalized glycemic control. While pump therapy alone does not normalize blood glucose, it may provide an important convenience for those Type-1 Diabetics who find carrying insulin or medical supplies to be a burden.
4. Continuous glucose monitor

Figure 15 Modified Illustration of Continuous Glucose Monitor and Dexcom Receiver Devices

Continuous Glucose Monitoring (CGM) technology overcame one of the biggest hurdles a Type-1 Diabetic encounters: not knowing what their blood glucose is in between blood meter tests. CGM allows for continuous assessment of estimated blood glucose levels.
How does it work?
A cannula/sensor is inserted into the adipose tissue (DexCom, 2012). The cannula/sensor is coated with an enzyme that breaks downs glucose (glucose oxidase) and creates hydrogen peroxide as a reaction product (Figure 16). The hydrogen peroxide produces an electrical signal within the transmitter. This signal is transmitted to the receiver (phone, watch, or hand-held device) where it is converted to an “estimated blood glucose” levels using periodic inputs from a blood glucose meter. Once completed, the receiver produces minute-by-minute updates (24/7) on “estimated blood glucose” levels. Since the cannula/sensor is placed into the adipose tissue and not the blood, how is it determining blood glucose values? Glucose flows from the blood to the interstitial fluid in the adipose tissue. The CGM picks up the glucose in the interstitial fluid and provides an indirect indication of blood glucose levels

Figure 16 Continuous Blood Glucose Schematic
The accuracy of this technology has improved dramatically since its first release (Laffel, 2016). The receivers are set to warn patients of dramatic blood glucose swings and values outside of the prescribed range. They can warn patients if they are or going to experience hyperglycemia or hypoglycemia, which can be critical during periods of hypoglycemic unawareness (sleep). Additionally, most CGM devices come with software which can provide information on blood glucose values and trends. I consider this technology to be the most informative for Type-1 Diabetics assessing glycemic control.
Does it improve glycemic control in patients?

Langendam et al. conducted a meta-analysis on 22 different studies looking at the glycemic control achieved with only blood glucose meters or with the addition of a CGM (with or without a pump) across timeframes ranging from 6 to 18 months (Langendam et al., 2012).This meta-analysis could not report baseline HbA1c values, but did indicate that patients using a CGM lowered their HbA1c 0.2% (6mg/dl). The authors found that when patients used a CGM and an insulin pump they lowered A1c by 0.7% (20mg/dL). Both analyses indicate no substantial improvement in glycemic control. None the less, the CGM does provide a tremendous tool into glycemic awareness with 24/7 feedback into how food, exercise, lifestyle, etc. modulate blood glucose levels, along with critical awareness of hyperglycemia and hypoglycemia.

Table 9 HbA1c Continuous Glucose Monitoring or Continuous Glucose Monitoring with an Insulin Pump Versus Controls. Modified Tables from (Langendam et al., 2012)
5. Closed Loop (Automated CGM + Insulin Pump)

Closed Loop is a term to describe an automated system utilizing both a CGM and Insulin Pump (Figure 17). The CGM informs the insulin pump on how much insulin to administer and the pump infuses it automatically. Minimal human input is required. Consequently, this technology has been termed the “artificial pancreas.” This technology provides a tremendous convenience for Type-1 Diabetics who do not want to be bothered by the manual micromanagement of daily blood glucose and insulin control. However, to keep this technology safe even with the potential for computer error, precautions were made to prevent blood glucose from going below 120mg/dL (lower threshold). This lower threshold provides safety but also limits this system ability to normalize blood glucose levels.
Does it improve glycemic control in patients?

Garg et al. observed 124 Type-1 Diabetic (30 children and 94 adults) using a closed loop system for 3 months (Garg et al., 2017). Both children and adults showed reductions in HbA1c by 0.6% and 0.5%, respectively (Table 9). These results are similar to other closed loop trials (Messer et al., 2018) and manual CGM and Insulin Pump administration (Langendam et al., 2012). Figure 18 illustrates the average blood glucose trends in patients using these closed loop devices. These graphs illustrate the safety and limitations of this technology. The glucose levels are automatically controlled between 130-180mg/dL without allowing for glucose to go below 120mg/dL. The closed loop technology presents both a safe and extremely convenient technology, although it does not normalize blood glucose into the healthy range. However, Type-1 Diabetics are customizing these closed loop systems to remove the 120mg/dL low threshold to allow for the pump to normalize blood glucose levels (https://openaps.org).

Table 10 HbA1c During “Run In” Phase (first two weeks of calibration with closed loop system) and 3-Months After Using Closed Loop in Both Adults and Children. Tables 2 from (Garg et al., 2017)

Figure 18 of the average blood (~135-170mg/dL) glucose gather from continuous blood glucose monitoring system during the “run in” (gray) and post-calibration (red) in children (1A) and adults (1B). Figures 1A&B from (Garg et al., 2017)
6. Islet-Cell and Pancreatic Transplantation
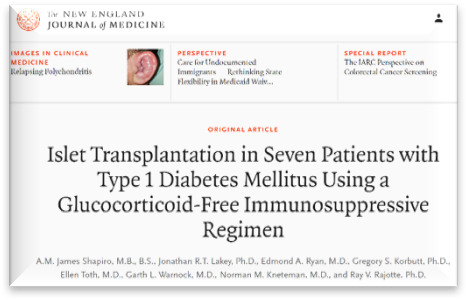
The destruction of pancreatic beta-cells causes Type-1 Diabetics. Reestablishing functional beta-cells would be considered a “cure.” Shapiro et al. conducted a groundbreaking study in 2000 when they implanted Type-1 Diabetic patients with islet cells from donor pancreases (Shapiro et al., 2000). Patients were implanted with islet cells using 2-3 pancreases worth of tissue gifted from donor cadavers.
Does it improve glycemic control in patients?
Shapiro et al. reported their results in Table 11. They normalized glycemic control! They brought HbA1c down to 5.7% (2.7% HbA1c; 77mg/dL drop in average blood glucose) 3-months post transplantation! This groundbreaking report gave hope to many Type-1 Diabetes patients that a “cure” was possible and forthcoming. However, the excitement was short lived when the 2-year follow up report indicated that only 36% of the patients had remaining transplant function (Shapiro et al., 2006).

Table 11 HbA1c Pre, 3-Month Post, and 6-Month Post Implantation of Donor Islet Cells into Type-1 Diabetics. Tables 2 from (Shapiro et al., 2000)
While both pancreatic and islet-cell transplantations present huge breakthrough and potential future therapeutic options, they are not yet ready for widespread use for the following reasons:
1) Surgical procedure.
a. Whole pancreatic transplantation requires major abdominal surgery and comes with higher risk, while islet-cell infusions requires minor surgery access to portal vein and is a lower risk procedure (Almehthel M, 2015; Diabetes Canada Clinical Practice Guidelines Expert, Senior, AlMehthel, Miller, & Paty, 2018).
2) Immunosuppressants
a. Transplanting foreign donor tissue has a very high risk of immune system rejection, a process termed graft-versus-host disease. Consequently, long-term immunosuppressants are used to reduce transplantation rejection. While these medications have minimal side effects, life-threatening opportunistic infections can occur when the immune system is compromised (Alejandro, Barton, Hering, Wease, & Collaborative Islet Transplant Registry, 2008; Gruessner, Sutherland, & Gruessner, 2004).
3) Temporary Transplant Lifespan
a. Even with immunosuppressants, transplants can still be rejected over time. Whole pancreatic transplants are reported to have a median survival of 9 years (Everly, 2009). Previous islet-cell transplant reports indicated a 5-year transplant efficacy (exogenous insulin-independent) of 10% (Ryan et al., 2005), but recent reports indicated a 60% 5-year efficacy (Qi et al., 2014).
4) Limited Donor Supply
a. Pancreas’ and islet-cells are currently gathered from cadavers and most transplants require tissue from ~1-3 donors. Consequently, transplants are limited. Attempts are underway to derive beta-cells from stem cells (Chhabra & Brayman, 2013).
5) Mixed Glycemic Efficacy
a. There have been reports of whole pancreatic transplant patients showing marked improvement in glycemic control, HbA1c (5.8-6.0%), and glucose tolerance (Lauria et al., 2010). Similarly, individuals who received islet-cell transplantation have reported improved glycemic control, HbA1c (5.6-5.7%), and protection from severe hypoglycemia (Hering et al., 2016; Shapiro et al., 2000). However, some reports indicate elevated HbA1c (>6.5%) post-transplant and patient are required to go back into insulin therapy (Mobley et al., 2017; Thompson et al., 2011). Part of this issue is “Post-Transplant Diabetes Mellitus” where patients found out they have Type-2 diabetes after they receive their transplant (Shivaswamy, Boerner, & Larsen, 2016).
6) Large Financial Cost
a. This therapeutic option is still commonly considered experimental and thus is only covered by research cost or patient expense.
7. BCG VACCINE


Table 12 HbA1c at Baseline, 5-Years, 7-years, and 8-Years Post BCG vaccine. Supplemental Table from (Kuhtreiber et al., 2018)
In 2018, a news article came out describing a breakthrough in Type-1 Diabetes management. It was hyped as “A potential cure for Type-1 Diabetes” https://asweetlife.org/has-dr-denise-faustman-found-a-cure-for-type-1-diabetes/ (Team, 2018). This article was referencing a small pilot trial that looked at the efficacy of a double dose vaccine given to a small number of patients (Kuhtreiber et al., 2018). What these researchers found was that 5 and 8 years post-vaccine administration, they saw significant reductions in HbA1c (7.37 to 6.18 at year 5 and 6.65 at year 8). The study provided evidence that the vaccines rewired the immune systems metabolism by switching immune cells away from oxidative metabolism to aerobic glycolysis. Metabolically this vaccine appears to work similarly to metformin. While these results show promise, this trial also had very small number of participants (n=9 at the 5-year follow up; n=3 at the 8-year follow up). This study also did not track insulin, diet, lifestyle, etc., so it is impossible to conclude whether the vaccines or other lifestyle factors contributed to the HbA1c drop that occurred. While this is FAR from a cure, it does present a potential therapeutic option to help lower HbA1c and will require larger clinical trials to confirm these findings.
8. STEM CELLS
Stem Cells have been considered as a potential therapy option to restore beta-cell function and overcome autoimmunity (Chhabra & Brayman, 2013). However, due to the nature of Type-1 Diabetes autoimmune onset, newly generated beta-cells are still at risk for immune destruction. Alternatively, stem cells have been proposed as a way to alter or suppress the immune system to overcome autoimmunity. Various multifactorial therapeutic protocols have been developed to try to reprogram the immune system in hopes of altering its autoreactivity to beta-cells (Couri & Voltarelli, 2009). Some reports indicate temporary success in patient with residual beta cell function who can remain insulin free for temporary periods of time. However, long term restoration of beta-cell for Type-1 Diabetics, especially those who have no residual beta-cell function, still appears to be far away.
PROGRESS?
Looking at the above data on various techniques and technological tools, it appears that these “solutions,” while helpful, are not making a substantial impact of glycemic management control across the entire Type-1 Diabetes population. However, this is hard to prove without longitudinal data on glycemic management. However, in early 2019, Foster et al. looked at glycemic management in a cohort of >20,000 Type-1 Diabetes participants from 2010-2012 to 2016-2018 (Foster et al., 2019). In Figure 19, when assessing the mean HbA1c across time, the authors found that reported mean HbA1c went from 7.8% in 2010-2012 to 8.4% in 2016-2018, with pediatric population most adversely effected. This recent assessment of glycemic management in Type-1 Diabetics indicates that within the last decade, glycemic management does not appear to be improving, and actually may be worsening…

Figure 19 HbA1c from 2010-2012 to 2016-2018. Modified Figure 2 from (Foster et al., 2019) illustrating diminished glycemic control over the last decade.
Attempts to “cure” Type-1 Diabetes include immunomodulatory approaches, beta-cell transplants, and stem cell therapies. While many of these areas are under active investigation, a “cure” is unlikely to come quickly. Finding ways to optimize islet cell transplants, stem cell therapies, and/or overcome autoimmunity is no small task, but will be required to retain long-lasting glucose sensing and insulin secreting cells. Consequently, most Type-1 Diabetics must rely on the current treatment options including nutritional strategies, increased glucose monitoring and injection techniques, computer assisted glucose monitoring and insulin infusion technology, etc. While some of these approaches have proven to help improve glycemic control, none of these current treatment options have proven to normalize blood glucose control. In fact, far from it.
Does this mean that Type-1 Diabetics cannot achieve glycemic control and are destined to have both acute and chronic complications and risks? Or is there a therapy that Type-1 Diabetics can implement RIGHT NOW that has proven to normalize their glycemic control and potentially reduce the risk for complications and shortened lifespan?
This and more will be covered in Section 3.
Story at a glance:
Hemoglobin is the oxygen-carrying protein inside red blood cells that transport oxygen from your lungs to other tissues to allow for the production of energy
Hemoglobin A1c (HbA1c) is a variant of hemoglobin that binds glucose (aka glycosylated Hemoglobin A)
HbA1c is the most important and predictive/diagnostic biomarker for diabetic health as it determines the average blood glucose levels over a 2- to 3-month period
o Average blood glucose levels correlate strongly with HbA1c; the higher the blood glucose, the more glucose binds Hemoglobin A, therefore the higher HbA1c levels
Type-1 Diabetics have an average blood glucose ~2x that of normal healthy levels – chronically elevated blood glucose levels can lead to serious long-term health complications
Higher HbA1c’s are associated with more blood glucose variability/instability and a variety of risks and complications including symptoms of both hypoglycemia and hyperglycemia on a day-to-day basis that are extremely dangerous for Type-1 Diabetics
Type-1 Diabetics are at an increased risk for all 10 of the current leading causes of death and on average are predicted to live a decade shorter than non-diabetics therefore a Type-1 Diabetes diagnosis is not simply one diagnosis but rather at an increased risk for various other diseases
Current diabetic treatment strategies or technologies and whether they offer glycemic control in patients:
1. Carbohydrate counting – Tracking carbohydrate consumption to determine insulin requirements (e.g. 15 carbohydrates:1IU insulin). Study shows a decrease in HbA1c over a 2-year time frame but does not come close to offering the glycemic control to that of a healthy individual.
2. Intensive treated therapy – Frequent monitoring of blood glucose and and ≥3 insulin injections/day. Studies show a significant decrease in HbA1c levels, however average blood glucose still remained elevated well above the healthy blood glucose range.
3. Insulin pumps – A pump worn at all times to infuse insulin in both basal and bolus doses removing the burden of multiple insulin injections/day. No studies have shown this modality to normalize blood glucose, but has eluted to its convenience for patients.
4. Continuous glucose monitor (CGM) – As the name suggests, CGM measures blood glucose levels continuously throughout the day allowing for constant assessment of glycemic control. While in and of itself CGM does not offer glycemic control, it is a tremendous tool for assessing how different lifestyle factors modulate blood glucose levels in addition to offering awareness of hyperglycemia and hypoglycemia on a 24/7 basis.
5. Closed loop (automated CGM + insulin pump) – An automated system that manages daily blood glucose and insulin control with minimal human input, precautions are made to prevent blood glucose from going below 120mg/dL. This system is safe and convenient, but has not been shown to normalize blood glucose into the healthy range. Customizing these systems to remove the 120mg/dL threshold may offer glycemic control closer to that of a healthy individual.
6. Islet-cell and pancreatic transplantation – Implantation of islet cells from donor pancreases to re-establish functional pancreatic beta-cells. Short-term (3-months post transplantation), this modality normalized glycemic control in one study, but after 2-years only 36% of the patients had remaining transplant function, indicating that this method is not currently reliable for glycemic control.
7. BCG Vaccine – A vaccine that switches immune cells from oxidative metabolism to aerobic glycolysis (high glucose utilization). Small pilot trials have shown reductions in HbA1c up to 8-years post vaccine administration, however due to many factors overlooked during these trials, this modality can only present itself as a potential therapeutic option to help lower HbAc1.
8. Stem cells – A potential therapy to restore beta-cell function and overcome autoimmunity, however, this therapy is still in its early stages and only temporary short-term successes have been reported.
Progress – Longitudinal data over the last decade illustrates that Type-1 Diabetes glycemic control has regressed.
Type-1 Diabetics must rely on glycemic management strategies since a “cure” is unlikely to be available in the near future
Current treatment options have not yet proven to normalize blood glucose levels
References:
Alejandro, R., Barton, F. B., Hering, B. J., Wease, S., & Collaborative Islet Transplant Registry, I. (2008). 2008 Update from the Collaborative Islet Transplant Registry. Transplantation, 86(12), 1783-1788. doi:10.1097/TP.0b013e3181913f6a
Almehthel M, P. B., Thompson DM. (2015). Progress of Islet Transplantation over the Last 15 Years. US Endocrinology, 11(2), 70-74.
American Diabetes, A. (2010). Diagnosis and classification of diabetes mellitus. Diabetes Care, 33 Suppl 1, S62-69. doi:10.2337/dc10-S062
Atkinson, M. A., Eisenbarth, G. S., & Michels, A. W. (2014). Type 1 diabetes. Lancet, 383(9911), 69-82. doi:10.1016/S0140-6736(13)60591-7
Bluestone, J. A., Herold, K., & Eisenbarth, G. (2010). Genetics, pathogenesis and clinical interventions in type 1 diabetes. Nature, 464(7293), 1293-1300.
Bonfig, W., Kapellen, T., Dost, A., Fritsch, M., Rohrer, T., Wolf, J., . . . the German Bundesministerium fur Bildung und Forschung Competence Net for Diabetes, M. (2012). Growth in children and adolescents with type 1 diabetes. J Pediatr, 160(6), 900-903 e902. doi:10.1016/j.jpeds.2011.12.007
Carstensen, B., Read, S. H., Friis, S., Sund, R., Keskimaki, I., Svensson, A. M., . . . Cancer Research, C. (2016). Cancer incidence in persons with type 1 diabetes: a five-country study of 9,000 cancers in type 1 diabetic individuals. Diabetologia, 59(5), 980-988. doi:10.1007/s00125-016-3884-9
Ceriello, A. (2005). Postprandial hyperglycemia and diabetes complications: is it time to treat? Diabetes, 54(1), 1-7.
Chaytor, N. S. (2016). Cognition in Adults and Older Adults With Type 1 Diabetes: Chicken or Egg? Diabetes Spectr, 29(4), 219-224. doi:10.2337/ds16-0050
Chaytor, N. S., Barbosa-Leiker, C., Ryan, C. M., Germine, L. T., Hirsch, I. B., & Weinstock, R. S. (2018). Clinically significant cognitive impairment in older adults with type 1 diabetes. J Diabetes Complications. doi:10.1016/j.jdiacomp.2018.04.003
Chhabra, P., & Brayman, K. L. (2013). Stem cell therapy to cure type 1 diabetes: from hype to hope. Stem Cells Transl Med, 2(5), 328-336. doi:10.5966/sctm.2012-0116
Chiang, J. L., Kirkman, M. S., Laffel, L. M., Peters, A. L., & Type 1 Diabetes Sourcebook, A. (2014). Type 1 diabetes through the life span: a position statement of the American Diabetes Association. Diabetes Care, 37(7), 2034-2054. doi:10.2337/dc14-1140
Constance A, H. C., Hayes C, Pereira R, Ross T, Swift C. (2011). My Carbohydrate Guide. In. Retrieved from http://www.lillydiabetes.com/_assets/pdf/ld90766_carbguide.pdf
Conway, B. N., Lopes-Virella, M. F., & Blot, W. J. (2018). Late adulthood mortality among African-American and white American people with Type 1 diabetes according to age at diabetes diagnosis. Diabet Med, 35(6), 729-736. doi:10.1111/dme.13617
Couri, C. E., & Voltarelli, J. C. (2009). Stem cell therapy for type 1 diabetes mellitus: a review of recent clinical trials. Diabetol Metab Syndr, 1(1), 19. doi:10.1186/1758-5996-1-19
Daneman, D. (2005). Early diabetes-related complications in adolescents: risk factors and screening. Horm Res, 63(2), 75-85. doi:10.1159/000083692
DexCom, I. (2012). United States Patent No.
Diabetes, C., Complications Trial /Epidemiology of Diabetes, I., & Complications Study Research, G. (2016). Mortality in Type 1 Diabetes in the DCCT/EDIC Versus the General Population. Diabetes Care, 39(8), 1378-1383. doi:10.2337/dc15-2399
Diabetes, C., Complications Trial Research, G., Nathan, D. M., Genuth, S., Lachin, J., Cleary, P., . . . Siebert, C. (1993). The effect of intensive treatment of diabetes on the development and progression of long-term complications in insulin-dependent diabetes mellitus. N Engl J Med, 329(14), 977-986. doi:10.1056/NEJM199309303291401
Diabetes, C., Complications Trial/Epidemiology of Diabetes, I., Complications Research, G., Nathan, D. M., Zinman, B., Cleary, P. A., . . . Orchard, T. J. (2009). Modern-day clinical course of type 1 diabetes mellitus after 30 years' duration: the diabetes control and complications trial/epidemiology of diabetes interventions and complications and Pittsburgh epidemiology of diabetes complications experience (1983-2005). Arch Intern Med, 169(14), 1307-1316. doi:10.1001/archinternmed.2009.193
Diabetes Canada Clinical Practice Guidelines Expert, C., Senior, P. A., AlMehthel, M., Miller, A., & Paty, B. W. (2018). Diabetes and Transplantation. Can J Diabetes, 42 Suppl 1, S145-S149. doi:10.1016/j.jcjd.2017.10.017
Everly, M. J. (2009). Pancreas transplantation in the United States: an analysis of the UNOS registry. Clin Transpl, 75-81.
Exchange, T. D. T1D Discover. Retrieved from https://t1dexchange.org/pages/resources/our-data/t1d-discover/
Exchange, T. D. T1D Discovery Tool. Retrieved from https://t1dexchange.org/pages/resources/our-data/
Fong, D. S., Aiello, L., Gardner, T. W., King, G. L., Blankenship, G., Cavallerano, J. D., . . . American Diabetes, A. (2004). Retinopathy in diabetes. Diabetes Care, 27 Suppl 1, S84-87.
Forbes, J. M., & Cooper, M. E. (2013). Mechanisms of diabetic complications. Physiol Rev, 93(1), 137-188. doi:10.1152/physrev.00045.2011
Foster, N. C., Beck, R. W., Miller, K. M., Clements, M. A., Rickels, M. R., DiMeglio, L. A., . . . Garg, S. K. (2019). State of Type 1 Diabetes Management and Outcomes from the T1D Exchange in 2016-2018. Diabetes Technol Ther, 21(2), 66-72. doi:10.1089/dia.2018.0384
Fox, L. A., Hershey, T., Mauras, N., Arbelaez, A. M., Tamborlane, W. V., Buckingham, B., . . . Diabetes Research in Children, N. (2018). Persistence of abnormalities in white matter in children with type 1 diabetes. Diabetologia, 61(7), 1538-1547. doi:10.1007/s00125-018-4610-6
Frohlich-Reiterer, E. E., Kaspers, S., Hofer, S., Schober, E., Kordonouri, O., Pozza, S. B., . . . Diabetes Patienten Verlaufsdokumentationssystem-Wiss Study, G. (2011). Anthropometry, metabolic control, and follow-up in children and adolescents with type 1 diabetes mellitus and biopsy-proven celiac disease. J Pediatr, 158(4), 589-593 e582. doi:10.1016/j.jpeds.2010.09.050
Garg, S. K., Weinzimer, S. A., Tamborlane, W. V., Buckingham, B. A., Bode, B. W., Bailey, T. S., . . . Kaufman, F. R. (2017). Glucose Outcomes with the In-Home Use of a Hybrid Closed-Loop Insulin Delivery System in Adolescents and Adults with Type 1 Diabetes. Diabetes Technol Ther, 19(3), 155-163. doi:10.1089/dia.2016.0421
Gebel, E. (2012). The start of something good: the discovery of HbA(1c) and the American Diabetes Association Samuel Rahbar Outstanding Discovery Award. Diabetes Care, 35(12), 2429-2431. doi:10.2337/dc12-1763
Goksen, D., Atik Altinok, Y., Ozen, S., Demir, G., & Darcan, S. (2014). Effects of carbohydrate counting method on metabolic control in children with type 1 diabetes mellitus. J Clin Res Pediatr Endocrinol, 6(2), 74-78. doi:10.4274/Jcrpe.119110.4274/Jcrpe.1190
Group, U. P. D. S. U. (1998). Intensive blood-glucose control with sulphonylureas or insulin compared with conventional treatment and risk of complications in patients with type 2 diabetes (UKPDS 33). UK Prospective Diabetes Study (UKPDS) Group. Lancet, 352(9131), 837-853.
Gruessner, R. W., Sutherland, D. E., & Gruessner, A. C. (2004). Mortality assessment for pancreas transplants. Am J Transplant, 4(12), 2018-2026. doi:10.1111/j.1600-6143.2004.00667.x
Hannon, T. S., & Rogol, A. D. (2012). Diabetes mellitus and growth in children and adolescents. J Pediatr, 160(6), 893-894. doi:10.1016/j.jpeds.2012.01.037
He, J., Ryder, A. G., Li, S., Liu, W., & Zhu, X. (2018). Glycemic extremes are related to cognitive dysfunction in children with type 1 diabetes: A meta-analysis. J Diabetes Investig. doi:10.1111/jdi.12840
Hering, B. J., Clarke, W. R., Bridges, N. D., Eggerman, T. L., Alejandro, R., Bellin, M. D., . . . Clinical Islet Transplantation, C. (2016). Phase 3 Trial of Transplantation of Human Islets in Type 1 Diabetes Complicated by Severe Hypoglycemia. Diabetes Care, 39(7), 1230-1240. doi:10.2337/dc15-1988
Hietala, K., Harjutsalo, V., Forsblom, C., Summanen, P., Groop, P. H., & FinnDiane Study, G. (2010). Age at onset and the risk of proliferative retinopathy in type 1 diabetes. Diabetes Care, 33(6), 1315-1319. doi:10.2337/dc09-2278
Holmquist, W. R., & Schroeder, W. A. (1966). A new N-terminal blocking group involving a Schiff base in hemoglobin AIc. Biochemistry, 5(8), 2489-2503.
Hünefeld, F. L. (1840). Die Chemismus in der thierischen Organization. Leipzig Brockhaus.
Hypoglycemia in the Diabetes Control and Complications Trial. The Diabetes Control and Complications Trial Research Group. (1997). Diabetes, 46(2), 271-286.
International Expert, C. (2009). International Expert Committee report on the role of the A1C assay in the diagnosis of diabetes. Diabetes Care, 32(7), 1327-1334. doi:10.2337/dc09-9033
Karges, B., Schwandt, A., Heidtmann, B., Kordonouri, O., Binder, E., Schierloh, U., . . . Holl, R. W. (2017). Association of Insulin Pump Therapy vs Insulin Injection Therapy With Severe Hypoglycemia, Ketoacidosis, and Glycemic Control Among Children, Adolescents, and Young Adults With Type 1 Diabetes. JAMA, 318(14), 1358-1366. doi:10.1001/jama.2017.13994
Kennedy, R. L., Henry, J., Chapman, A. J., Nayar, R., Grant, P., & Morris, A. D. (2002). Accidents in patients with insulin-treated diabetes: increased risk of low-impact falls but not motor vehicle crashes--a prospective register-based study. J Trauma, 52(4), 660-666.
Khadilkar, V. V., Parthasarathy, L. S., Mallade, B. B., Khadilkar, A. V., Chiplonkar, S. A., & Borade, A. B. (2013). Growth status of children and adolescents with type 1 diabetes mellitus. Indian J Endocrinol Metab, 17(6), 1057-1060. doi:10.4103/2230-8210.122623
Kilpatrick, E. S., Rigby, A. S., & Atkin, S. L. (2008a). A1C variability and the risk of microvascular complications in type 1 diabetes: data from the Diabetes Control and Complications Trial. Diabetes Care, 31(11), 2198-2202. doi:10.2337/dc08-0864
Kilpatrick, E. S., Rigby, A. S., & Atkin, S. L. (2008b). Mean blood glucose compared with HbA1c in the prediction of cardiovascular disease in patients with type 1 diabetes. Diabetologia, 51(2), 365-371. doi:10.1007/s00125-007-0883-x
Klein, R., Klein, B. E., Moss, S. E., Davis, M. D., & DeMets, D. L. (1984). The Wisconsin epidemiologic study of diabetic retinopathy. II. Prevalence and risk of diabetic retinopathy when age at diagnosis is less than 30 years. Arch Ophthalmol, 102(4), 520-526.
Klein, R., Knudtson, M. D., Lee, K. E., Gangnon, R., & Klein, B. E. (2008). The Wisconsin Epidemiologic Study of Diabetic Retinopathy: XXII the twenty-five-year progression of retinopathy in persons with type 1 diabetes. Ophthalmology, 115(11), 1859-1868. doi:10.1016/j.ophtha.2008.08.023
Koenig, R. J., & Cerami, A. (1975). Synthesis of hemoglobin AIc in normal and diabetic mice: potential model of basement membrane thickening. Proc Natl Acad Sci U S A, 72(9), 3687-3691.
Koenig, R. J., Peterson, C. M., Jones, R. L., Saudek, C., Lehrman, M., & Cerami, A. (1976). Correlation of glucose regulation and hemoglobin AIc in diabetes mellitus. N Engl J Med, 295(8), 417-420. doi:10.1056/NEJM197608192950804
Kuenen, J. C., Borg, R., Kuik, D. J., Zheng, H., Schoenfeld, D., Diamant, M., . . . Group, A. S. (2011). Does glucose variability influence the relationship between mean plasma glucose and HbA1c levels in type 1 and type 2 diabetic patients? Diabetes Care, 34(8), 1843-1847. doi:10.2337/dc10-2217
Kuhtreiber, W. M., Tran, L., Kim, T., Dybala, M., Nguyen, B., Plager, S., . . . Faustman, D. L. (2018). Long-term reduction in hyperglycemia in advanced type 1 diabetes: the value of induced aerobic glycolysis with BCG vaccinations. NPJ Vaccines, 3, 23. doi:10.1038/s41541-018-0062-8
Lachin, J. M., Genuth, S., Nathan, D. M., Zinman, B., Rutledge, B. N., & Group, D. E. R. (2008). Effect of glycemic exposure on the risk of microvascular complications in the diabetes control and complications trial--revisited. Diabetes, 57(4), 995-1001. doi:10.2337/db07-1618
Laffel, L. (2016). Improved Accuracy of Continuous Glucose Monitoring Systems in Pediatric Patients with Diabetes Mellitus: Results from Two Studies. Diabetes Technol Ther, 18 Suppl 2, S223-233. doi:10.1089/dia.2015.0380
Langendam, M., Luijf, Y. M., Hooft, L., Devries, J. H., Mudde, A. H., & Scholten, R. J. (2012). Continuous glucose monitoring systems for type 1 diabetes mellitus. Cochrane Database Syst Rev, 1, CD008101. doi:10.1002/14651858.CD008101.pub2
Lauria, M. W., Figueiro, J. M., Machado, L. J., Sanches, M. D., Nascimento, G. F., Lana, A. M., & Ribeiro-Oliveira, A., Jr. (2010). Metabolic long-term follow-up of functioning simultaneous pancreas-kidney transplantation versus pancreas transplantation alone: insights and limitations. Transplantation, 89(1), 83-87. doi:10.1097/TP.0b013e3181bd0f83
Lind, M., Svensson, A. M., Kosiborod, M., Gudbjornsdottir, S., Pivodic, A., Wedel, H., . . . Rosengren, A. (2014). Glycemic control and excess mortality in type 1 diabetes. N Engl J Med, 371(21), 1972-1982. doi:10.1056/NEJMoa1408214
Livingstone, S. J., Levin, D., Looker, H. C., Lindsay, R. S., Wild, S. H., Joss, N., . . . Scottish Renal, R. (2015). Estimated life expectancy in a Scottish cohort with type 1 diabetes, 2008-2010. JAMA, 313(1), 37-44. doi:10.1001/jama.2014.16425
Livingstone, S. J., Looker, H. C., Hothersall, E. J., Wild, S. H., Lindsay, R. S., Chalmers, J., . . . Colhoun, H. M. (2012). Risk of cardiovascular disease and total mortality in adults with type 1 diabetes: Scottish registry linkage study. PLoS Med, 9(10), e1001321. doi:10.1371/journal.pmed.1001321
Maahs, D. M., West, N. A., Lawrence, J. M., & Mayer-Davis, E. J. (2010). Epidemiology of type 1 diabetes. Endocrinol Metab Clin North Am, 39(3), 481-497. doi:10.1016/j.ecl.2010.05.011
Mazaika, P. K., Weinzimer, S. A., Mauras, N., Buckingham, B., White, N. H., Tsalikian, E., . . . Diabetes Research in Children, N. (2016). Variations in Brain Volume and Growth in Young Children With Type 1 Diabetes. Diabetes, 65(2), 476-485. doi:10.2337/db15-1242
McKnight, J. A., Wild, S. H., Lamb, M. J., Cooper, M. N., Jones, T. W., Davis, E. A., . . . Miller, K. M. (2015). Glycaemic control of Type 1 diabetes in clinical practice early in the 21st century: an international comparison. Diabet Med, 32(8), 1036-1050. doi:10.1111/dme.12676
Messer, L. H., Forlenza, G. P., Sherr, J. L., Wadwa, R. P., Buckingham, B. A., Weinzimer, S. A., . . . Slover, R. H. (2018). Optimizing Hybrid Closed-Loop Therapy in Adolescents and Emerging Adults Using the MiniMed 670G System. Diabetes Care, 41(4), 789-796. doi:10.2337/dc17-1682
Mobley, C. B., Mumford, P. W., Kephart, W. C., Haun, C. T., Holland, A. M., Beck, D. T., . . . Roberts, M. D. (2017). Aging in Rats Differentially Affects Markers of Transcriptional and Translational Capacity in Soleus and Plantaris Muscle. Front Physiol, 8, 518. doi:10.3389/fphys.2017.00518
Murphy SL, X. J., Kochanek KD, Curtin SC, Arias E. (2017). Deaths: Final data for 2015. National Vital Statistics Reports. Retrieved from Hyattsville, MD:
Nathan, D. M., Cleary, P. A., Backlund, J. Y., Genuth, S. M., Lachin, J. M., Orchard, T. J., . . . Complications Study Research, G. (2005). Intensive diabetes treatment and cardiovascular disease in patients with type 1 diabetes. N Engl J Med, 353(25), 2643-2653. doi:10.1056/NEJMoa052187
Nathan, D. M., & Group, D. E. R. (2014). The diabetes control and complications trial/epidemiology of diabetes interventions and complications study at 30 years: overview. Diabetes Care, 37(1), 9-16. doi:10.2337/dc13-2112
NIDDK. (2008). DCCT and EDIC: The Diabetes Control and Complications Trial and Follow-up Study. Retrieved from https://www.niddk.nih.gov/-/media/Files/Research-Areas/DCCT-EDIC_508.pdf?la=en
Nunley, K. A., Rosano, C., Ryan, C. M., Jennings, J. R., Aizenstein, H. J., Zgibor, J. C., . . . Saxton, J. A. (2015). Clinically Relevant Cognitive Impairment in Middle-Aged Adults With Childhood-Onset Type 1 Diabetes. Diabetes Care, 38(9), 1768-1776. doi:10.2337/dc15-0041
Parthasarathy, L., Khadilkar, V., Chiplonkar, S., & Khadilkar, A. (2016). Longitudinal Growth in Children and Adolescents with Type 1 Diabetes. Indian Pediatr, 53(11), 990-992.
Perutz, M. F. (1960). Structure of haemoglobin. Paper presented at the Brookhaven symposia in biology.
Perutz, M. F., Rossmann, M. G., Cullis, A. F., Muirhead, H., Will, G., & North, A. C. (1960). Structure of haemoglobin: a three-dimensional Fourier synthesis at 5.5-A. resolution, obtained by X-ray analysis. Nature, 185(4711), 416-422.
Pinhas-Hamiel, O., Hamiel, U., Boyko, V., Graph-Barel, C., Reichman, B., & Lerner-Geva, L. (2014). Trajectories of HbA1c levels in children and youth with type 1 diabetes. PLoS One, 9(10), e109109. doi:10.1371/journal.pone.0109109
Qi, M., Kinzer, K., Danielson, K. K., Martellotto, J., Barbaro, B., Wang, Y., . . . Oberholzer, J. (2014). Five-year follow-up of patients with type 1 diabetes transplanted with allogeneic islets: the UIC experience. Acta Diabetol, 51(5), 833-843. doi:10.1007/s00592-014-0627-6
Rahbar, S. (1968). An abnormal hemoglobin in red cells of diabetics. Clin Chim Acta, 22(2), 296-298.
Rahbar, S., Blumenfeld, O., & Ranney, H. M. (1969). Studies of an unusual hemoglobin in patients with diabetes mellitus. Biochem Biophys Res Commun, 36(5), 838-843.
Rawshani, A. S., N.; Franzén, S.; Rawshani, A.; Hattersley, A. T.; Svensson, A.; Eliasson, B.; Gudbjörnsdottir, S. (2018). Excess mortality and cardiovascular disease in young adults with type 1 diabetes in relation to age at onset: a nationwide, register-based cohort. The Lancet, 392, 477-486.
Rohlfing, C. L., Wiedmeyer, H. M., Little, R. R., England, J. D., Tennill, A., & Goldstein, D. E. (2002). Defining the relationship between plasma glucose and HbA(1c): analysis of glucose profiles and HbA(1c) in the Diabetes Control and Complications Trial. Diabetes Care, 25(2), 275-278.
Rombopoulos, G., Hatzikou, M., Latsou, D., & Yfantopoulos, J. (2013). The prevalence of hypoglycemia and its impact on the quality of life (QoL) of type 2 diabetes mellitus patients (The HYPO Study). Hormones (Athens), 12(4), 550-558.
Ryan, E. A., Paty, B. W., Senior, P. A., Bigam, D., Alfadhli, E., Kneteman, N. M., . . . Shapiro, A. M. (2005). Five-year follow-up after clinical islet transplantation. Diabetes, 54(7), 2060-2069.
S.L., T. (2011). Abnormalities of the structure and synthesis of hemoglobin. In C. Livingston (Ed.), Blood and Bone Marrow Pathology (pp. 131-155).
Sarkar, S., & Balhara, Y. P. (2014). Diabetes mellitus and suicide. Indian J Endocrinol Metab, 18(4), 468-474. doi:10.4103/2230-8210.137487
Shapiro, A. M., Lakey, J. R., Ryan, E. A., Korbutt, G. S., Toth, E., Warnock, G. L., . . . Rajotte, R. V. (2000). Islet transplantation in seven patients with type 1 diabetes mellitus using a glucocorticoid-free immunosuppressive regimen. N Engl J Med, 343(4), 230-238. doi:10.1056/NEJM200007273430401
Shapiro, A. M., Ricordi, C., Hering, B. J., Auchincloss, H., Lindblad, R., Robertson, R. P., . . . Lakey, J. R. (2006). International trial of the Edmonton protocol for islet transplantation. N Engl J Med, 355(13), 1318-1330. doi:10.1056/NEJMoa061267
Sherr, J. L., Boyle, C. T., Miller, K. M., Beck, R. W., Tamborlane, W. V., & Network, T. D. E. C. (2016). No Summer Vacation From Diabetes: Glycemic Control in Pediatric Participants in the T1D Exchange Registry Based on Time of Year. Diabetes Care, 39(12), e214-e215. doi:10.2337/dc16-1522
Shivaswamy, V., Boerner, B., & Larsen, J. (2016). Post-Transplant Diabetes Mellitus: Causes, Treatment, and Impact on Outcomes. Endocr Rev, 37(1), 37-61. doi:10.1210/er.2015-1084
Simonsen, J. R., Harjutsalo, V., Jarvinen, A., Kirveskari, J., Forsblom, C., Groop, P. H., . . . FinnDiane Study, G. (2015). Bacterial infections in patients with type 1 diabetes: a 14-year follow-up study. BMJ Open Diabetes Res Care, 3(1), e000067. doi:10.1136/bmjdrc-2014-000067
Soedamah-Muthu, S. S., Fuller, J. H., Mulnier, H. E., Raleigh, V. S., Lawrenson, R. A., & Colhoun, H. M. (2006). High risk of cardiovascular disease in patients with type 1 diabetes in the U.K.: a cohort study using the general practice research database. Diabetes Care, 29(4), 798-804.
Songer, T. J., & Dorsey, R. R. (2006). High risk characteristics for motor vehicle crashes in persons with diabetes by age. Annu Proc Assoc Adv Automot Med, 50, 335-351.
Spiegel G, P. M. (2015). A Parent/Caregiver Guide: Carbohydrate Counting for Children with Diabetes. In. Retrieved from http://lillydiabetes.com/_assets/pdf/hi86638_carbohydrate_counting_for_children.pdf
Staff, M. C. (2018a). Hyperglycemia in Diabetes. Retrieved from https://www.mayoclinic.org/diseases-conditions/hyperglycemia/symptoms-causes/syc-20373631
Staff, M. C. (2018b). Hypoglycemia. Retrieved from https://www.mayoclinic.org/diseases-conditions/hypoglycemia/symptoms-causes/syc-20373685
Stahl, C. H., Lind, M., Svensson, A. M., Gudbjornsdottir, S., Martensson, A., & Rosengren, A. (2017). Glycaemic control and excess risk of ischaemic and haemorrhagic stroke in patients with type 1 diabetes: a cohort study of 33 453 patients. J Intern Med, 281(3), 261-272. doi:10.1111/joim.12572
Team, A. (2018). Has Dr. Denise Faustman Found a Cure for Type 1 Diabetes? Retrieved from https://asweetlife.org/has-dr-denise-faustman-found-a-cure-for-type-1-diabetes/
Thom, C. S., Dickson, C. F., Gell, D. A., & Weiss, M. J. (2013). Hemoglobin variants: biochemical properties and clinical correlates. Cold Spring Harb Perspect Med, 3(3), a011858. doi:10.1101/cshperspect.a011858
Thompson, D. M., Meloche, M., Ao, Z., Paty, B., Keown, P., Shapiro, R. J., . . . Warnock, G. L. (2011). Reduced progression of diabetic microvascular complications with islet cell transplantation compared with intensive medical therapy. Transplantation, 91(3), 373-378. doi:10.1097/TP.0b013e31820437f3
Turner, R. C. (1998). The U.K. Prospective Diabetes Study. A review. Diabetes Care, 21 Suppl 3, C35-38.
Vanstone, M., Rewegan, A., Brundisini, F., Dejean, D., & Giacomini, M. (2015). Patient Perspectives on Quality of Life With Uncontrolled Type 1 Diabetes Mellitus: A Systematic Review and Qualitative Meta-synthesis. Ont Health Technol Assess Ser, 15(17), 1-29.
White, N. H., Sun, W., Cleary, P. A., Danis, R. P., Davis, M. D., Hainsworth, D. P., . . . Nathan, D. M. (2008). Prolonged effect of intensive therapy on the risk of retinopathy complications in patients with type 1 diabetes mellitus: 10 years after the Diabetes Control and Complications Trial. Arch Ophthalmol, 126(12), 1707-1715. doi:10.1001/archopht.126.12.1707
Whitmer RA, B. G., Quesenberry CP Jr, Liu JY, Karter AJ, Beeri M. (2015). Type 1 diabetes and risk of dementia in late life: The kaiser diabetes & cognitive aging study. Paper presented at the Alzheimers and Dementia.
Yfantopoulos, J., Hatzikou, M., Rombopoulos, G., Panitti, E., & Latsou, D. (2014). The Prevalence of Hypoglycemia and Its Impact on The Quality of Life of Type 2 Diabetes Mellitus Patients in Greece (The Hypo Study). Value Health, 17(7), A356. doi:10.1016/j.jval.2014.08.759

